Institutional Growth And TGE Strategy Risks | Frontier Lab Weekly
Market Overview
Market Summary
This week, the cryptocurrency market exhibited a volatile trend, with both BTC and ETH showing a pattern of sideways appreciation. The Market Sentiment Index retreated from 70 last week to 63, though it remains firmly within the bullish zone.
Stablecoin Market Dynamics
The total market capitalization of stablecoins rose, characterized by a decline in USDT and an increase in USDC:
- USDT: Market cap reached $186.8 billion, down 0.16% WoW. The resurgence of net outflows suggests that despite the upward price volatility, non-U.S. investors primarily sought safe-haven exits.
- USDC: Market cap stood at $75.5 billion, up 0.66% WoW. Although the $500 million increase was modest, it reversed last week’s downtrend, indicating that U.S. investors are beginning to re-enter the market.
BTC Market Trading Volume
BTC market trading activity saw a significant increase compared to the previous week. Data shows that total BTC trading volume on Binance and Coinbase reached 221,221 coins, a notable rise from last week’s 194,188 coins. Specifically, Binance volume grew from 122,354 to 139,856 BTC, while Coinbase volume rose from 71,834 to 81,365 BTC, reflecting a recovery in investor sentiment.
BTC ETF Market Volume
The BTC ETF market also began to gradually recover its trading volume following the holiday break. Taking BlackRock’s IBIT — the market leader — as an example, weekly volume reached 298 million shares, up from the previous week’s 256 million shares.
Market Driver Analysis
Institutional Inflows Turn Positive
This week, BTC and ETH Spot ETFs along with publicly listed treasury companies increased their purchasing power, reversing the prior downward trend. Institutions such as Fidelity saw consistent growth in buying power, leading total buy volume to exceed sell volume this week. This signals a gradual recovery in investor enthusiasm and a strategic re-entry by U.S. investors.
Macro Data Performance Meets Expectations
While the U.S. CPI data released this week matched the 2.7% forecast, the Core PCE came in at 2.6%, lower than expected. Although this data does not shift the “no-cut” expectation for the Fed in January, it bolsters the probability of a Q1 rate cut, thereby lifting market sentiment.
Geopolitical Risks Fuel Volatility
Geopolitical tensions between the U.S. and Iran took several turns this week, shifting from initial saber-rattling to a softening of Trump’s stance, which fueled intense market volatility. Amidst this complex international climate, many investors opted to sell assets as a safe-haven measure, impacting asset prices.
Policy & Regulatory Progress
Regulatory Delays
Most investors anticipated the passage of the high-impact Clarity Act this week, but a delay was officially announced. This impacted investor sentiment, further exacerbated by Coinbase’s remark that provisions restricting stablecoin rewards are “worse than having no bill at all,” weighing on market optimism.
Fed-Government Friction
The escalating dispute between Trump and Powell has made the outlook for future Fed rate cuts increasingly opaque. Consequently, a growing number of investors are choosing to adopt a more cautious “wait-and-see” approach.
Next Week’s Key Event Forecasts
- Macro Data Vacuum: In the coming week, there are few major macroeconomic data releases, creating a brief data vacuum in the market.
- Institutional Purchasing Power as Key Metric: This week, BTC and ETH treasury companies and Spot ETFs reversed the previous trend of net selling, shifting to net buying. This indicates an improvement in market sentiment; as such, the sustainability of this trend should be a primary observation metric next week.
- Continued Geopolitical Monitoring: The trajectory of the U.S.-Iran geopolitical conflict warrants close attention in the coming week. This conflict can influence market trends in the short term, and should open conflict break out, it would inevitably exert a significant impact on risk-on markets.
Market Outlook
- Uncertainty in Buying Persistence: As the purchasing power of treasury companies and Spot ETFs remains an unknown for next week — often determined by market price action — it is highly possible that adverse data could lead to a reduction in buying power for short-term risk avoidance, causing a rapid decline.
- Maintaining High Caution: Given factors such as shifting institutional buying, changes in policy expectations, and geopolitical risks, investors should remain highly cautious. It is advised to strictly control risk exposure and prepare defensively for intense market volatility driven by data and geopolitical events.
Bearish Targets for Next Week
Targets: ZK, PLUME, XPL
ZK: TVL Plummets 81%, Activity Rate <0.1% — Layer 2 Trust Crisis Amidst Deteriorating Data
Project Fundamentals & Positioning:
ZKsync is an Ethereum Layer 2 scaling solution aimed at increasing transaction speeds and reducing costs via Zero-Knowledge proof technology. Utilizing a Rollup architecture, it processes transactions off-chain and submits validity proofs to the Ethereum mainnet for verification, achieving efficiency while maintaining security.
Comprehensive Decline in On-Chain Operations:
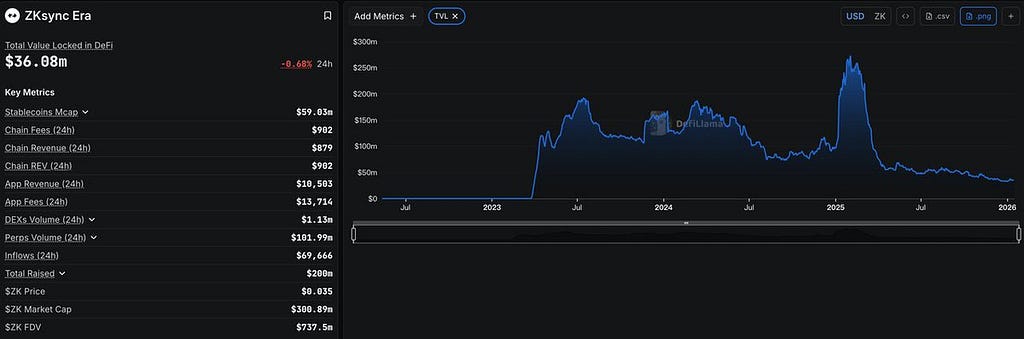
- Massive Capital Flight: ZKsync’s TVL has plunged from a high of $273 million to $36.08 million, an 86.78% decline, indicating liquidity exhaustion as capital exits the ecosystem.
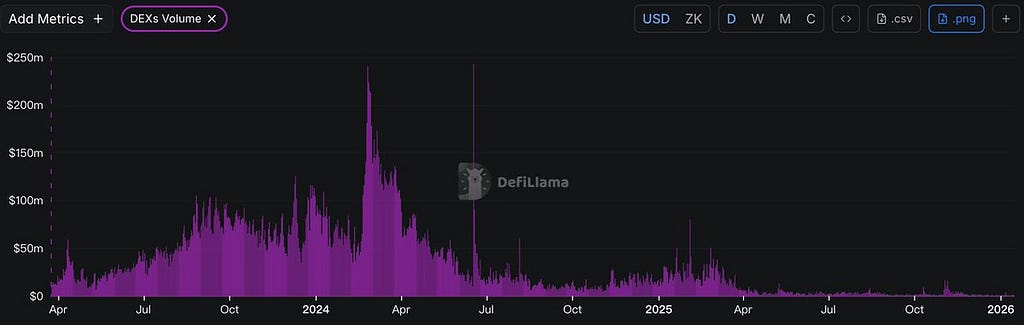
- Stagnant Trading Activity: On-chain DEX volume has persistently declined to approximately $700,000/day, reflecting extremely low user frequency and a lifeless ecosystem.
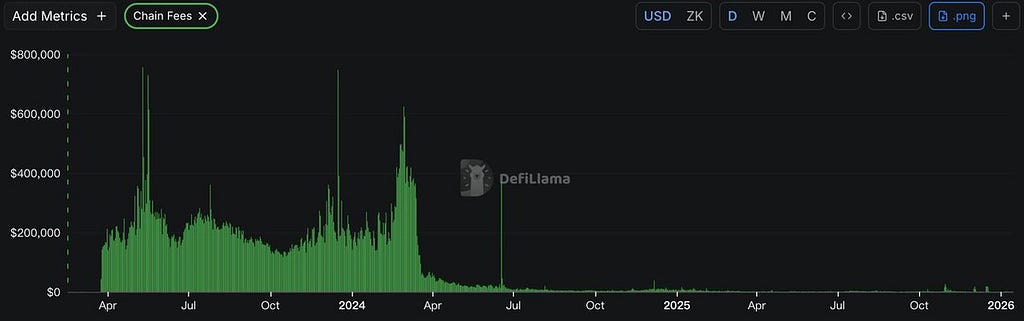
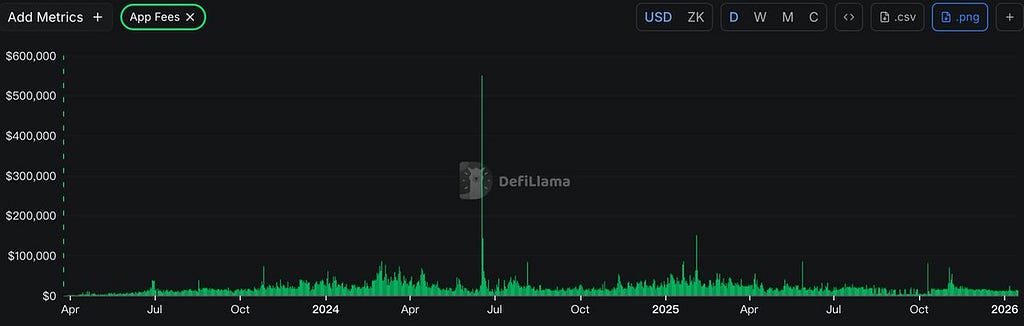
- Negligible Gas Revenue: Daily Gas revenue is only ~$876, with total dApp revenue at ~$11,000/day. This core metric reflects a lack of actual demand, characterizing it as a “dead chain.”
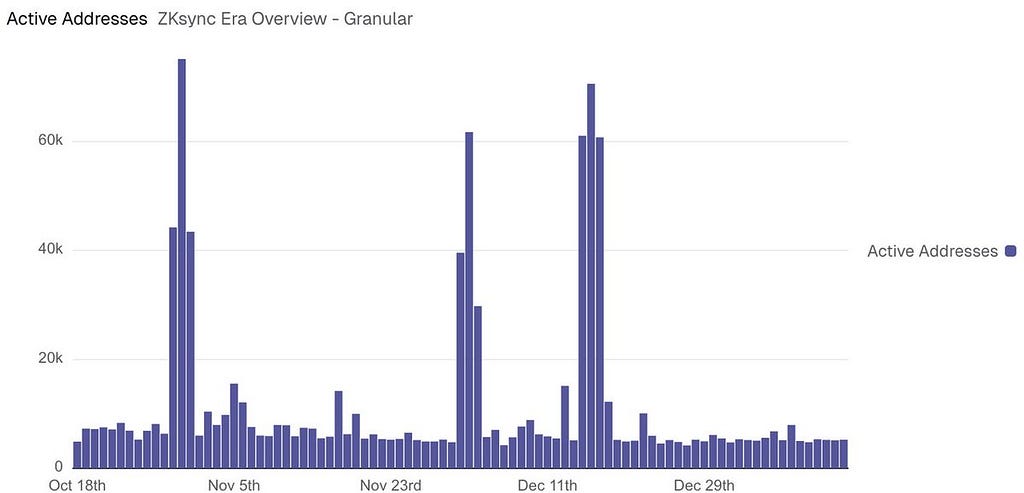
- Depressed User Engagement: Despite 10.71 million total accounts, daily active accounts are only ~5,000 (rate <0.1%). Declining new account numbers suggest a systematic user exit.
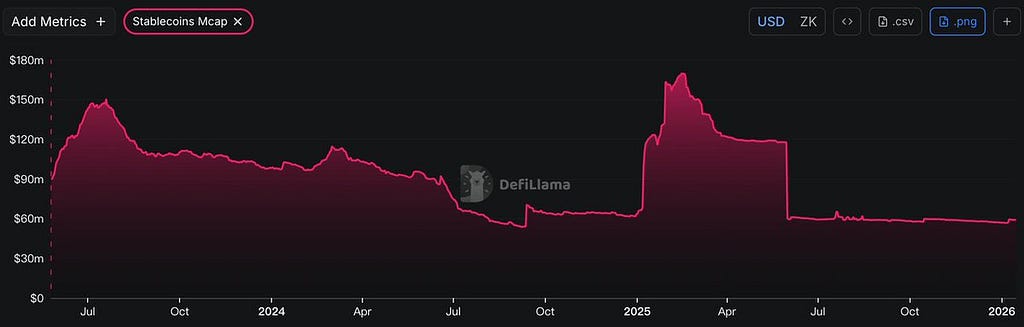
- Stablecoin Market Cap All-Time Low: Stablecoin market cap on ZKsync has hit a historic low of $59.09 million, with the downward trend signaling continuous capital outflow.
Supply Shock & Sell Pressure Analysis:
- Large Unlock Scale: On January 19, 163.74 million ZK tokens (0.78% of total locked supply) will unlock, posing significant pressure in the current climate.
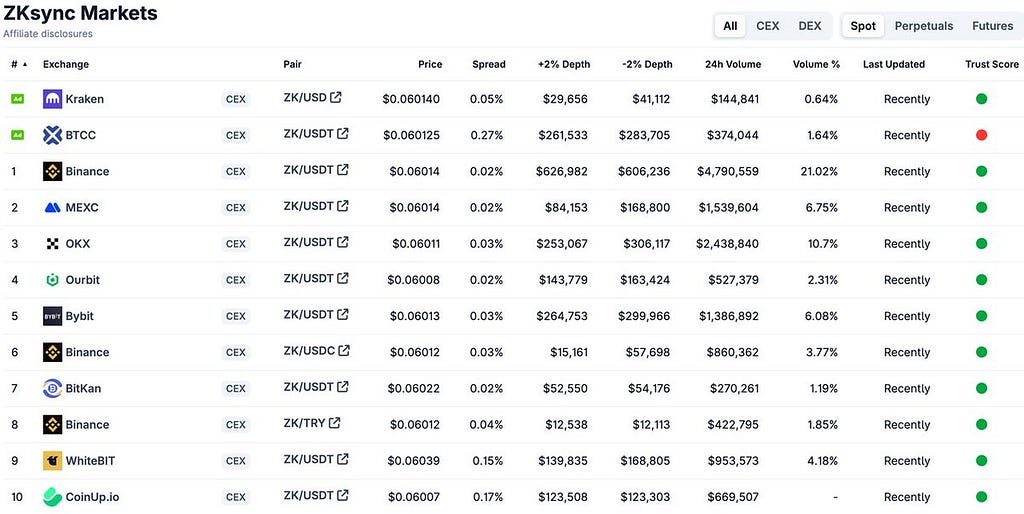
- Insufficient Market Depth: With daily trading volume at only ~$4.8 million, market liquidity is insufficient to absorb the impending unlock, impacting price.
- Strong Incentive to Sell: The unlock primarily involves VCs and the team. Given the project’s downward cycle, these holders have high motivation to liquidate and exit.
Summary:
ZKsync faces systematic risks: Layer 2 sector-wide trust issues, collapsed business metrics (TVL -86.78%, <0.1% active users), and a massive token unlock against thin liquidity. These factors exert persistent negative pressure on ZK price, with the project showing “dead chain” characteristics.
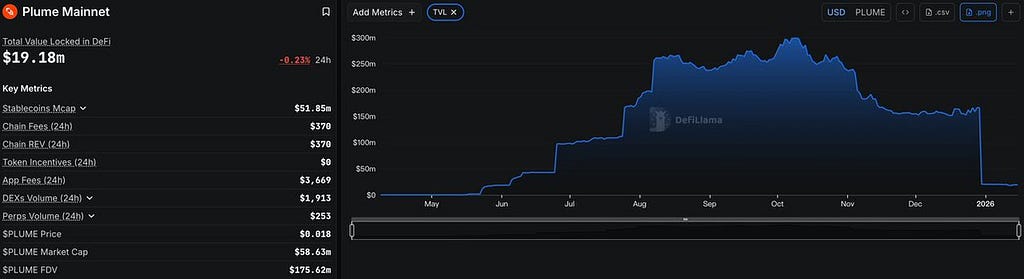
PLUME: TVL Plummets 94%, Activity Near Zero — 1.467B Token Unlock Triggers RWA Trust Crisis
Project Fundamentals & Positioning:
Plume is an EVM-compatible Layer 2 focused on RWAfi (Real-World Asset Finance), aiming to tokenize traditional assets (bonds, real estate) for high-efficiency DeFi integration.
Comprehensive Decline in On-Chain Operations:
- Massive Capital Flight: TVL has crashed from $299 million to $19.18 million (-93.58%), indicating total liquidity depletion.
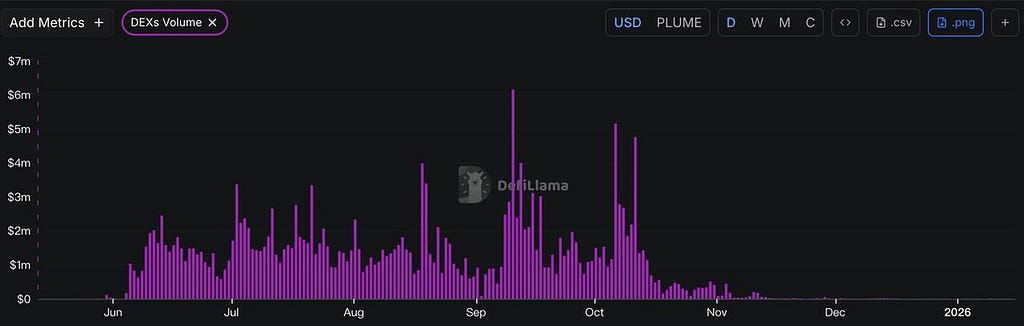
- Stagnant Trading: Daily DEX volume is ~ $1,100, significantly worse than ZKsync and reflecting a complete loss of vitality.
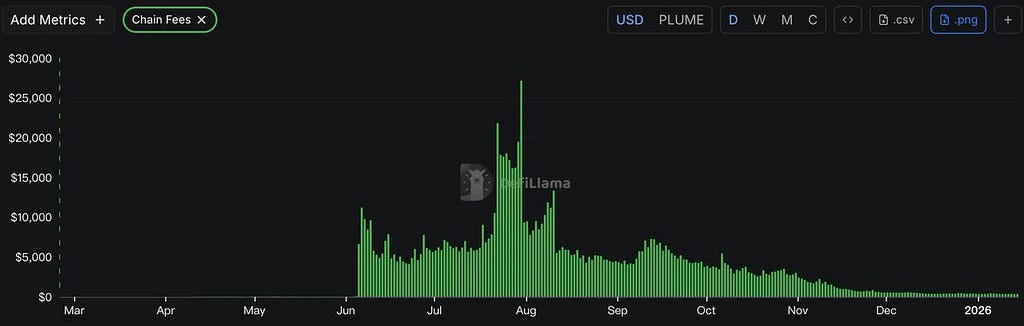
- Negligible Gas Fees: Daily fees are only ~$370, Paling in comparison to ZKsync’s $876. reflecting zero actual demand and “dead chain” status.
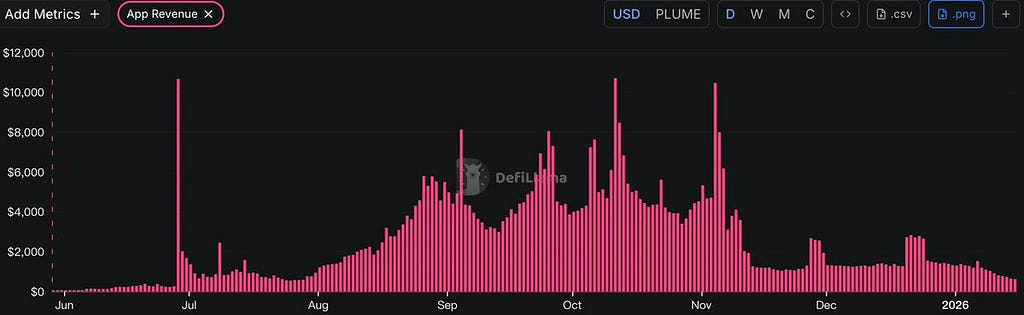
- Ecosystem Revenue Collapse: Total dApp revenue is ~$600/day, showing a loss of commercial value and sustainability.
Supply Shock & Sell Pressure Analysis:
- Massive Unlock Scale: On January 21, 1.467 billion PLUME tokens (14.68% of locked supply) will unlock, creating extreme sell pressure compared to ZKsync’s 0.78%.
- Market Inadequacy: Daily volume is only ~$3 million; the market cannot effectively digest such a massive unlock, posing a catastrophic threat to price.
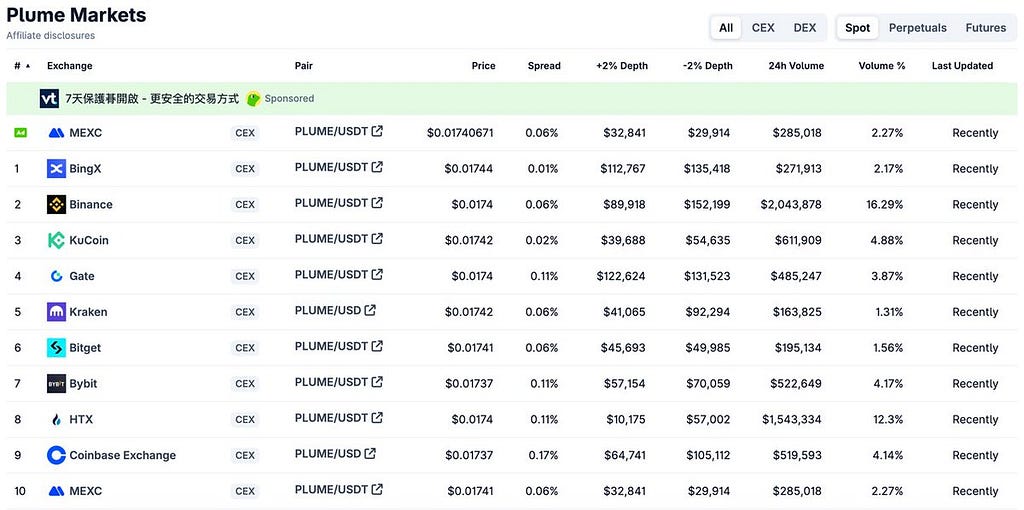
- High Exit Motivation: Targeted at investors and the team during a severe downtrend, large-scale liquidation is almost certain.
Summary:
Plume faces even more severe systematic risks than ZKsync. With a 94% TVL drop and negligible on-chain activity, the massive 14.68% supply unlock on January 21 creates destructive sell pressure. Investors should remain highly alert to this “dead chain” risk.
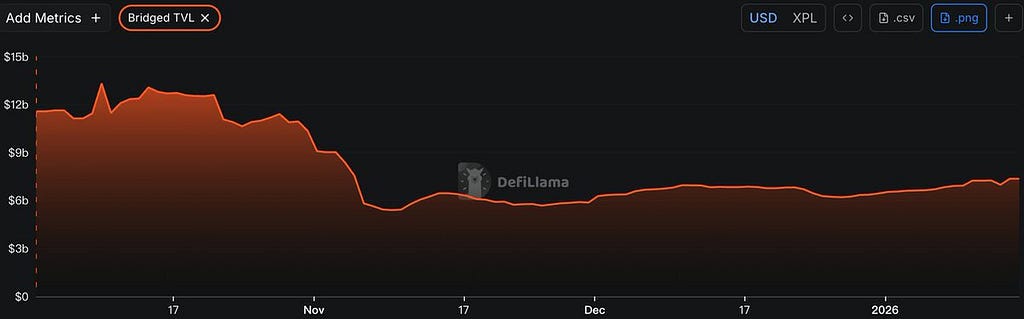
XPL: Stablecoin Chain Collapse, TVL Drops 49%, 88.88M Unlock Triggers Liquidity Crisis
Project Fundamentals & Positioning:
Plasma is a high-performance Layer 1 designed for stablecoin payments, aiming to solve high fees, poor UX, and slow settlement in financial infrastructure.
Deteriorating Fundamentals:
- Shrinking TVL: TVL dropped 47.01% from $6.358 billion to $3.369 billion as users and capital exit.
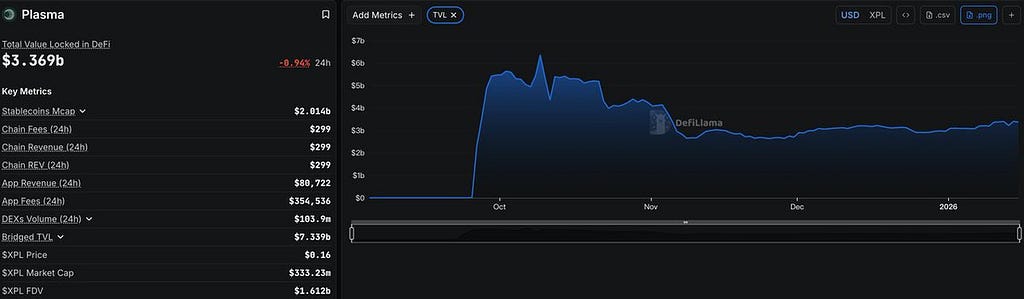
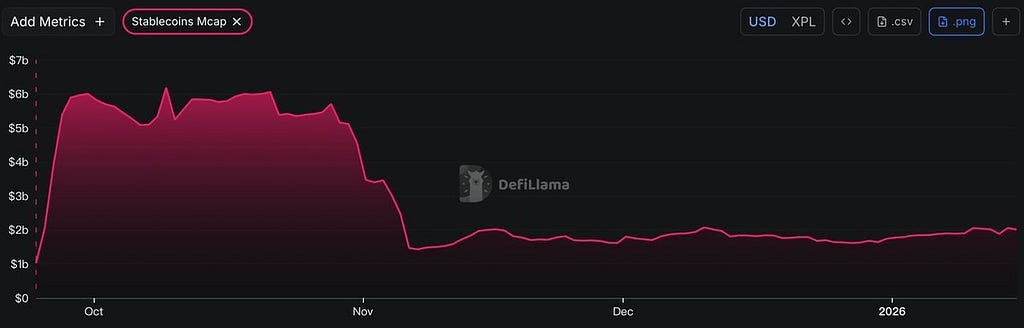
- Stablecoin Contraction: Stablecoin market cap on Plasma crashed 67.45% from $6.186 billion to $2.013 billion.
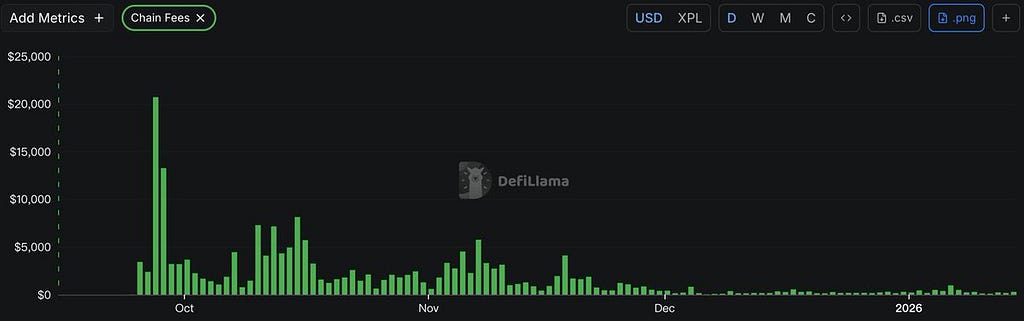
- Gas Revenue Slump: Daily Gas fees dropped to ~$300, showing network usage is near freezing point.
Cross-chain Outflow: Cross-chain TVL fell 44.73% from $13.319 billion to $7.361 billion.
- Broad Decline in User Activity: Synthesizing various on-chain data points, user activity within the Plasma ecosystem is trending downward across the board, indicating that the on-chain ecosystem has entered a state of deep recession.
Token Unlock Risk Assessment
- Unfavorable Unlock Scale and Timing: On January 25, 88.88 million XPL tokens are scheduled for unlock. Conducting a large-scale unlock at a critical juncture when the project’s fundamentals are continuously deteriorating is extremely poorly timed.
- Severe Lack of Market Absorption Capacity: The average daily trading volume for the XPL token is only around $12 million. Market liquidity is clearly insufficient to effectively absorb the volume of tokens about to be unlocked, which will create significant selling pressure.
- Thin Liquidity Depth: The relatively small daily trading volume reflects a lack of market depth, making it impossible to effectively buffer the price impact caused by the token unlock. Consequently, the selling pressure will translate directly into price depreciation.Summary:
Summary:
Plasma faces business decay across TVL and stablecoin metrics, combined with a significant token unlock on January 25. The lack of liquidity depth makes it difficult to reverse the downward trend in the short term.
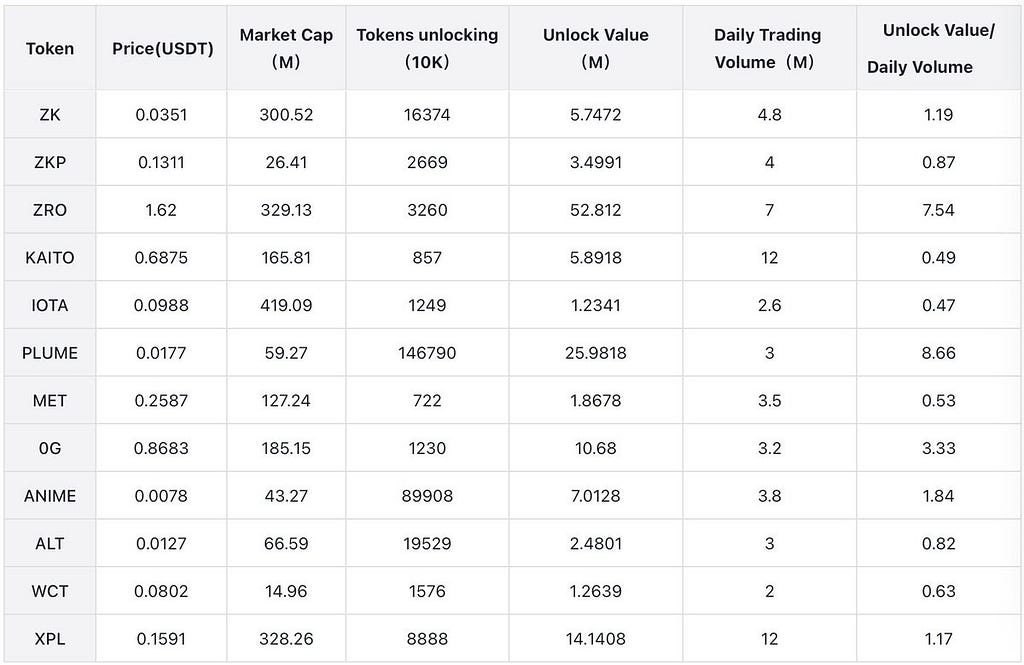
Token Unlock Schedule Next Week
(Unlock Value > $1 Million)
Market Sentiment Index Analysis
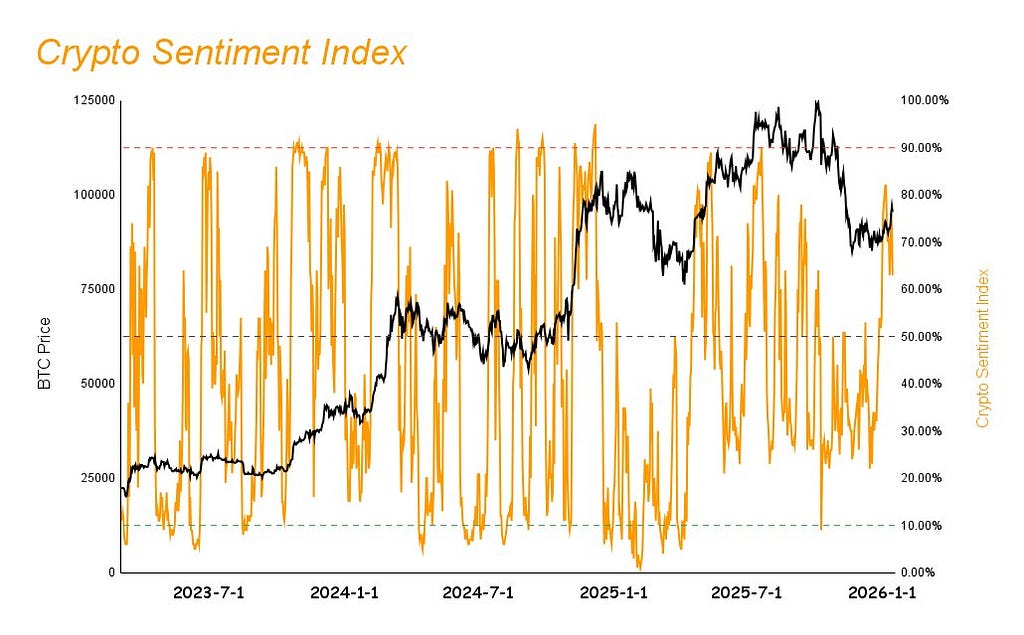
Market sentiment slipped from 70 → 63. Weekly: BTC +4.33%, ETH −4.94%, TOTAL3 +0.91%. Altcoins still holding bullish territory.
Weekly Hot Topic: The New TGE Paradigm
TGE New Paradigm: How Investors Lock in Risk-Free Returns in Pre-Markets
Event Background
As the cryptocurrency market evolves, the traditional Token Generation Event (TGE) model is facing significant challenges. A surge in projects with High Fully Diluted Valuations (FDV) and Low Circulating Supply (Low Float) has left secondary market investors facing immense selling pressure and price depreciation risks upon token listing. However, an emerging strategy combining pre-market trading, Over-the-Counter (OTC) deals, and prediction markets provides savvy investors with a powerful tool to lock in profits and hedge risks prior to the TGE. From an investor’s perspective, this article explores how to utilize this “Trinity” strategy to achieve hedging with zero liquidation risk, transforming market volatility into deterministic Alpha returns.
Investors’ Dilemma:High-Valuation Bubbles and Liquidity Traps
Since the second half of 2025, the crypto market has entered a new phase. On one hand, numerous projects are fundraising and marketing with FDVs in the billions or even tens of billions of dollars; on the other hand, initial circulating supply is extremely low, often representing less than 5% of the total supply. This “High FDV, Low Float” model creates massive paper wealth for early investors and project teams but poses severe challenges for secondary market participants post-TGE.
Once a token is listed, the locked tokens held by early investors and teams are gradually released over time, creating persistent selling pressure. Due to a lack of sufficient market depth and buy-side liquidity to absorb these sell orders, token prices often enter a prolonged downward channel after a brief initial spike upon listing. For average investors buying in the secondary market, this has become an almost certain “losing game.”
As Presto Research noted in its report: “An overwhelming number of new projects have entered the market, but there is no corresponding influx of participants or liquidity to support this massive supply. Consequently, as more tokens unlock, prices naturally decline.” Facing this structural risk, the traditional “Buy and Hold” strategy is no longer applicable. Investors urgently require advanced strategies capable of navigating bull and bear cycles, hedging downside risks, and locking in profits.
The “Trinity” Strategy for Risk-Free Hedging
A successful hedging strategy relies on three core pillars: obtaining discounted tokens in the pre-market, utilizing perpetual contracts for hedging, and leveraging prediction markets for sentiment analysis and price discovery.
Pillar 1: Pre-market Trading and OTC — Obtaining Discounted ChipsThe profit foundation of the hedging strategy stems from acquiring tokens at prices below public market expectations. This is primarily achieved through two channels:
- Secondary OTC Markets: Platforms such as Whales Market and STIX allow early investors, teams, or foundations to sell their locked tokens or SAFTs (Simple Agreement for Future Tokens) before the official listing. Because these tokens are subject to lock-up periods, sellers are often willing to provide substantial discounts in exchange for early liquidity.
- Project-led OTC Distribution: To lock in buy-side demand and manage expectations prior to TGE, project teams may allocate quotas directly to KOLs (Key Opinion Leaders) and high-net-worth communities. By participating in these private rounds, investors can secure prices and terms that are more attractive than those offered in public rounds.
Pillar 2: Perpetual Contracts — Constructing a Delta-Neutral HedgeAfter acquiring discounted tokens, the next step is to immediately hedge the risk of price volatility. This is achieved by establishing an equivalent short position on platforms that offer pre-listing perpetual contracts (such as Aevo).
- Core Mechanism: Buy Spot (or equivalents): Purchasing 10,000 locked tokens via OTC constitutes a long spot exposure. Short Futures: Opening a short position for 10,000 of the same tokens via perpetual contracts on Aevo.
- This combination of “Long Spot + Short Futures” constructs a Delta-Neutral position. Whether the token price rises or falls after TGE, the total value of the portfolio remains stable. Gains from the spot position are offset by losses in the futures position, and vice versa. This completely strips away price risk, leaving the investor’s return dependent solely on the initial discount rate.
- The key to zero liquidation risk lies in using 1x leverage. Since the investor holds an amount of spot (or forthcoming spot) equal to the short position, even if a massive price surge causes floating losses in the short position, its value is always covered by the appreciation of the spot. Thus, the liquidation threshold is never triggered.
Pillar 3: Polymarket — The Compass for Market SentimentPrediction markets like Polymarket play a supporting yet crucial role. Investors do not typically execute large trades on Polymarket but use it as a “compass” for market sentiment and price expectations.
- Price Discovery: Odds on Polymarket regarding “whether a token’s FDV will exceed
- billion post-TGE” intuitively reflect the collective market expectation of the project’s valuation. Investors can use this price as a reference to determine if their OTC discount is sufficiently attractive.
- Sentiment Monitoring: Trading volume and capital flow on relevant prediction markets serve as effective indicators of community FOMO. Overheated market sentiment may imply high funding rates for shorting perpetuals, which could impact arbitrage returns.
Strategy Execution: Locking in Profits Step-by-Step:
A complete risk-free hedging process is as follows:
- Intelligence Gathering: Seek quotas for unlisted projects with attractive discounts through communities, KOLs, or OTC platforms (e.g., Whales Market).
- Price Assessment: Reference Polymarket FDV predictions and Aevo pre-market prices to evaluate the profit margin of the OTC discount.
- Establishing Positions: Sign agreements with the seller (preferably via smart contract escrow like Whales Market) and pay for the locked tokens. Almost simultaneously, open an equivalent short position on Aevo with 1x leverage.
- Hold and Wait: Maintain the Delta-Neutral position until the token TGE and unlock occurs.
- Delivery and Closing: Receive tokens on the agreed delivery date. Transfer the tokens to an exchange and sell to close the long spot exposure. Simultaneously, close the perpetual short position on Aevo.
Profit Calculation:
- Total Profit ≈ (OTC Discount Rate — Transaction Fees — Funding Rate Costs) × Total Investment
- Example: An investor buys $100,000 worth of tokens at a 40% discount ($0.60 per token) and shorts them on Aevo. Assuming total fees and funding costs are 2%, the locked risk-free profit is: (40% — 2%) × 100,000 = $38,000.
Risks and Considerations
While the strategy is described as “liquid-risk-free,” other risks must be managed:
- Counterparty Risk: The primary risk. If the OTC seller defaults and refuses to deliver tokens post-TGE, the investor faces losses. Using reputable intermediaries or escrow contracts (e.g., Whales Market) significantly mitigates this.
- Platform Risk: Rebase mechanisms on platforms like Aevo may adjust positions and prices if the project’s actual total supply differs from the platform’s estimate, potentially increasing margin requirements instantly.
- Liquidity Risk: During the closing phase, insufficient liquidity in the spot or perpetual markets could lead to slippage losses.
Conclusion:
In the current market environment, TGE investing has evolved from simple value judgment into a complex, multi-dimensional game. By integrating pre-market OTC markets, perpetual contract hedging, and prediction market analysis, savvy investors can construct robust Delta-Neutral strategies. This transforms the “discount” paid by projects and early investors for liquidity into certain profit for the strategist. This approach not only eliminates price volatility risk and the possibility of liquidation but represents the ultimate wisdom for survival and profitability in the modern crypto market.
Next Week’s Crypto Events
- Thursday (Jan 22): U.S. Initial Jobless Claims.
- Friday (Jan 23): Michigan Consumer Sentiment Index (Final).
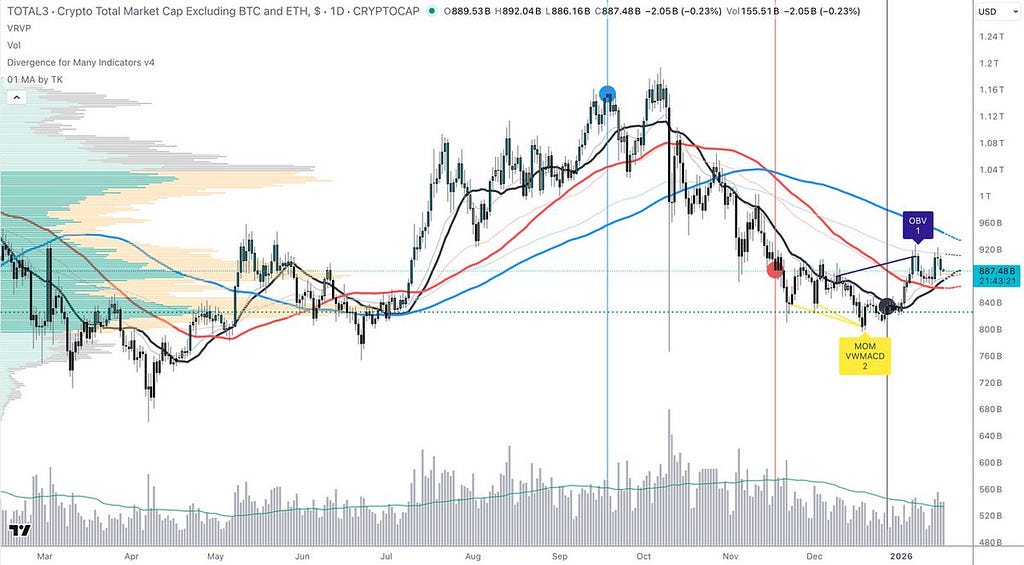
Sector Performance Overview
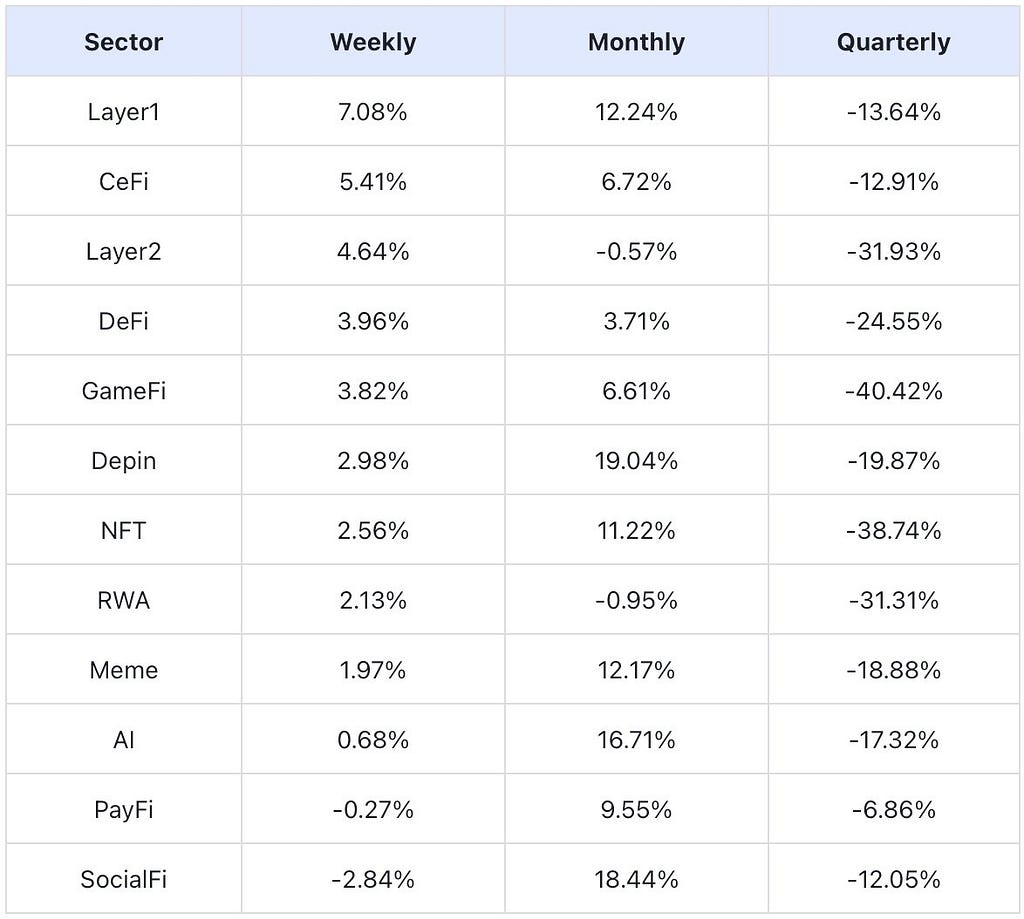
By weekly return, Layer 1 performed best, while SocialFi performed worst.
- Layer 1: Dominant assets (ETH, BNB, SOL, TRX, ADA) saw gains between 4.15% and 9.01%.
- SocialFi: TON’s -3.52% drag resulted in the sector underperforming despite gains in CHZ and MASK.
Summary
Market Performance & Stablecoin Dynamics
The cryptocurrency market exhibited a volatile yet upward trend this week, with both BTC and ETH recording positive returns. The Market Sentiment Index retreated from 70 last week to 63, maintaining its position within the bullish zone. The stablecoin market showed a notable divergence: USDT’s market cap reached $186.8 billion (a 0.16% WoW decrease), signaling a resurgence of net outflows as non-U.S. investors opted for profit-taking during the price rally. Conversely, USDC’s market cap rose to $75.5 billion (a 0.66% WoW increase); although the $500 million growth was modest, it reversed the previous week’s downtrend, indicating a re-entry by U.S. investors. Following the holiday period, BTC spot trading volume rebounded significantly, with combined volume on Binance and Coinbase reaching 221,221 BTC (up from 194,188 BTC last week). The ETF market similarly saw renewed activity, with BlackRock’s IBIT volume increasing from 256 million to 298 million shares.
Hot Topic: The New TGE Investment Paradigm
This week’s focus centered on the “New TGE Paradigm” investment strategy. As projects with High FDV and Low Float proliferate, traditional investment models are being challenged. A new “Trinity” hedging strategy — combining pre-market trading, perpetual contract hedging, and prediction market analysis — has emerged. By acquiring discounted allocations via OTC and constructing Delta-neutral positions, investors are locking in risk-free returns, representing a sophisticated evolution in modern crypto investment strategies.
Outlook & Key Risk Factors
Looking ahead to next week, the market will enter a macroeconomic data vacuum with no major indicators scheduled for release. Institutional purchasing power remains the primary metric to watch; whether the current “buy-over-sell” trend persists will directly reflect shifts in market sentiment. Geopolitical risks require continuous monitoring, as the trajectory of the U.S.-Iran conflict could impact market directions in the short term — any outbreak of hostilities would significantly shock risk-on markets. Furthermore, the sustainability of institutional buying remains uncertain. Amid adverse data, the market may see a sudden reduction in purchasing power due to short-term risk aversion, potentially triggering a rapid price correction. Given these overlapping risk factors, investors should maintain a highly cautious stance, strictly control risk exposure, and remain prepared for heightened volatility driven by geopolitical events and institutional fund flows.